Predictive Modeling of Extortion Hotspots Using GIS and Crime Data
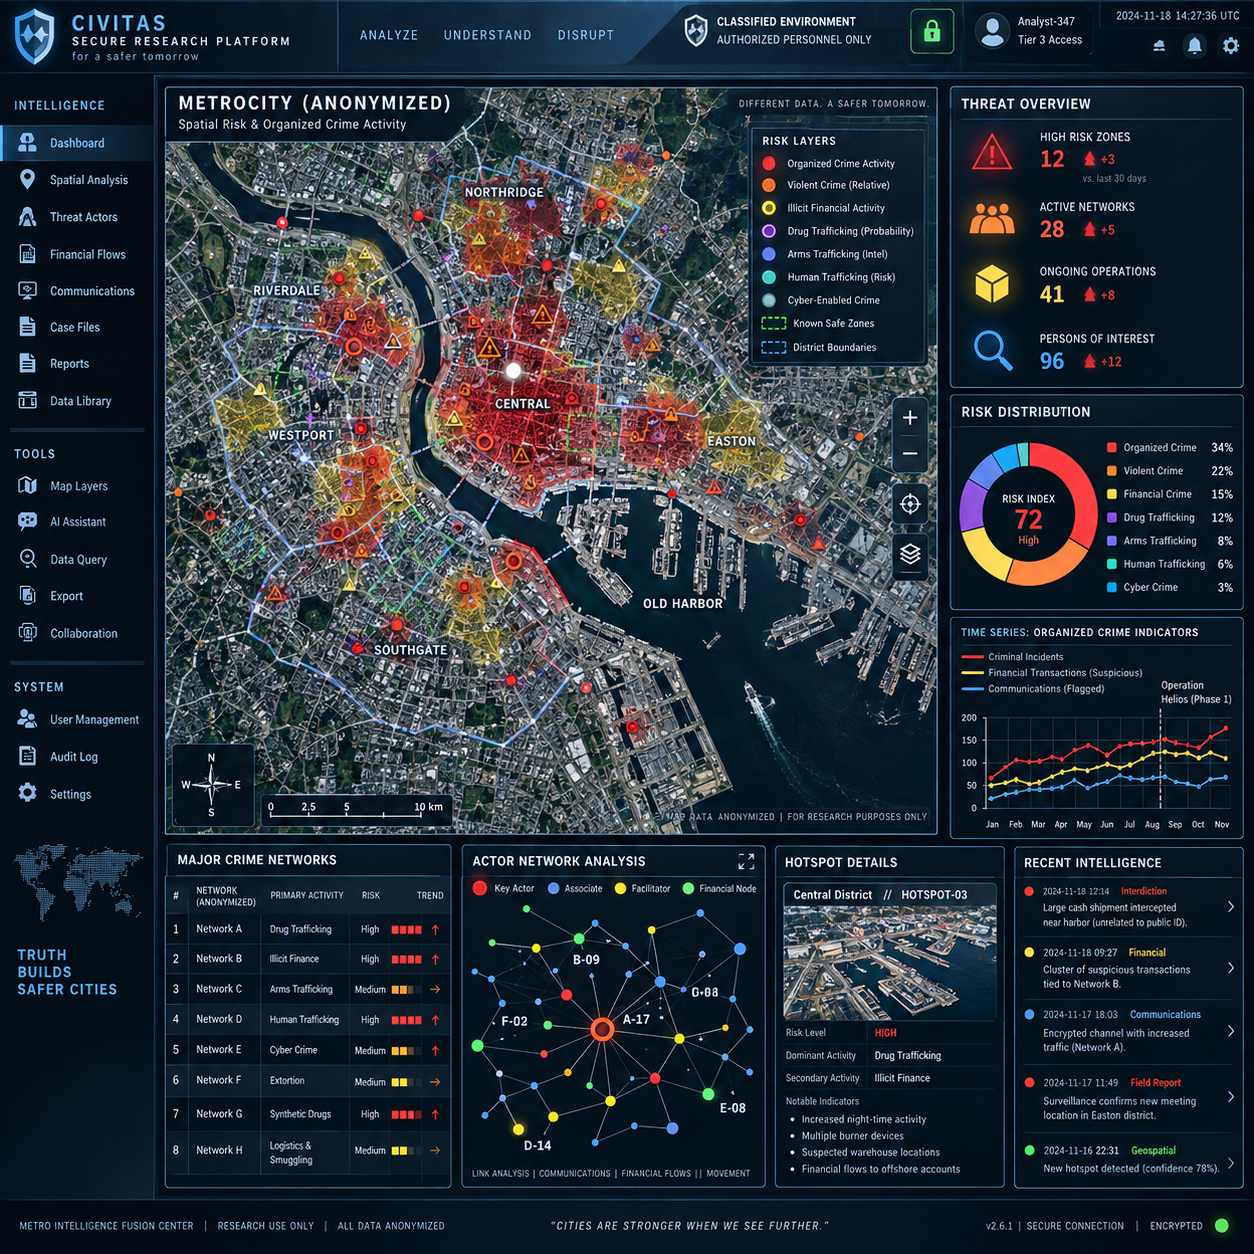
Predictive modeling of extortion hotspots combines geographic information systems (GIS), crime data, and statistical or machine-learning methods to estimate where reported or suspected extortion risk may be concentrated. The goal is not to label communities as criminal, but to help researchers and public agencies understand spatial patterns, improve prevention, and allocate limited resources responsibly.
Why Map and Predict Extortion Hotspots?
Extortion hotspot modeling identifies places and time periods where the risk, reporting, or observed concentration of extortion appears higher than expected. It supports organized-crime research by connecting incidents to geography, infrastructure, economic activity, and temporal change.
Extortion is geographically patterned because offenders, victims, intermediaries, and enforcement institutions operate within physical environments. Markets, transport corridors, commercial districts, ports, nightlife areas, and neighborhoods with particular vulnerabilities can shape exposure and reporting. Organized crime networks may also use territorial control, social relationships, and repeated contact with businesses or households.
A static map answers a descriptive question: where have incidents been recorded? A predictive model asks a different question: where might similar risk or reporting be observed in a future period, given historical patterns and contextual variables? Risk mapping should therefore be treated as an estimate with uncertainty, not as proof that extortion or organized-crime activity exists in a specific location.
These distinctions matter operationally. A map can support victim-support services, outreach, investigative prioritization, and prevention planning. It should not justify indiscriminate surveillance, automatic enforcement, or assumptions about residents. Researchers can consult the National Institute of Justice guidance on GIS and crime analysis when designing a transparent analytical workflow.
Data Requirements for Extortion Hotspot Modeling
Extortion hotspot models require incident, location, time, contextual, and reporting data that can be linked at a consistent geographic and temporal scale. The quality of the prediction depends more on measurement and coverage than on algorithmic complexity.
Core crime data may include complaints, police reports, prosecutor records, victimization surveys, hotline contacts, court documents, and verified investigative records. Useful fields can include:
- Incident date, reporting date, and, where appropriate, an agreed time window;
- Geographic coordinates or an address that can be safely generalized;
- Extortion type, alleged method, relationship between parties, and case status;
- Victim or business characteristics, recorded only when necessary and lawfully collected;
- Links to related incidents, repeat victimization, or suspected organized-crime networks;
- Outcome variables such as referral, investigation, prosecution, or closure.
Contextual variables can include population, business density, land use, road and transit access, market activity, income measures, unemployment, internet access, and the availability of police or victim-support services. These variables may help explain exposure or reporting, but they can also encode structural inequality. A neighborhood with more reports may have greater victimization, better access to reporting channels, or more intensive enforcement.
Underreporting is central to extortion research. Victims may fear retaliation, distrust authorities, depend economically on offenders, or view coercion as normal. Reporting behavior is therefore part of the phenomenon being modeled. Researchers should distinguish observed incidents from estimated underlying risk and document which sources are missing or overrepresented.
Preparing Crime Data for GIS Analysis
To prepare extortion crime data for GIS analysis, researchers must standardize locations and dates, remove duplicates, define spatial units, address missing values, and protect sensitive information before modeling. Careful preparation prevents technical precision from disguising unreliable measurements.
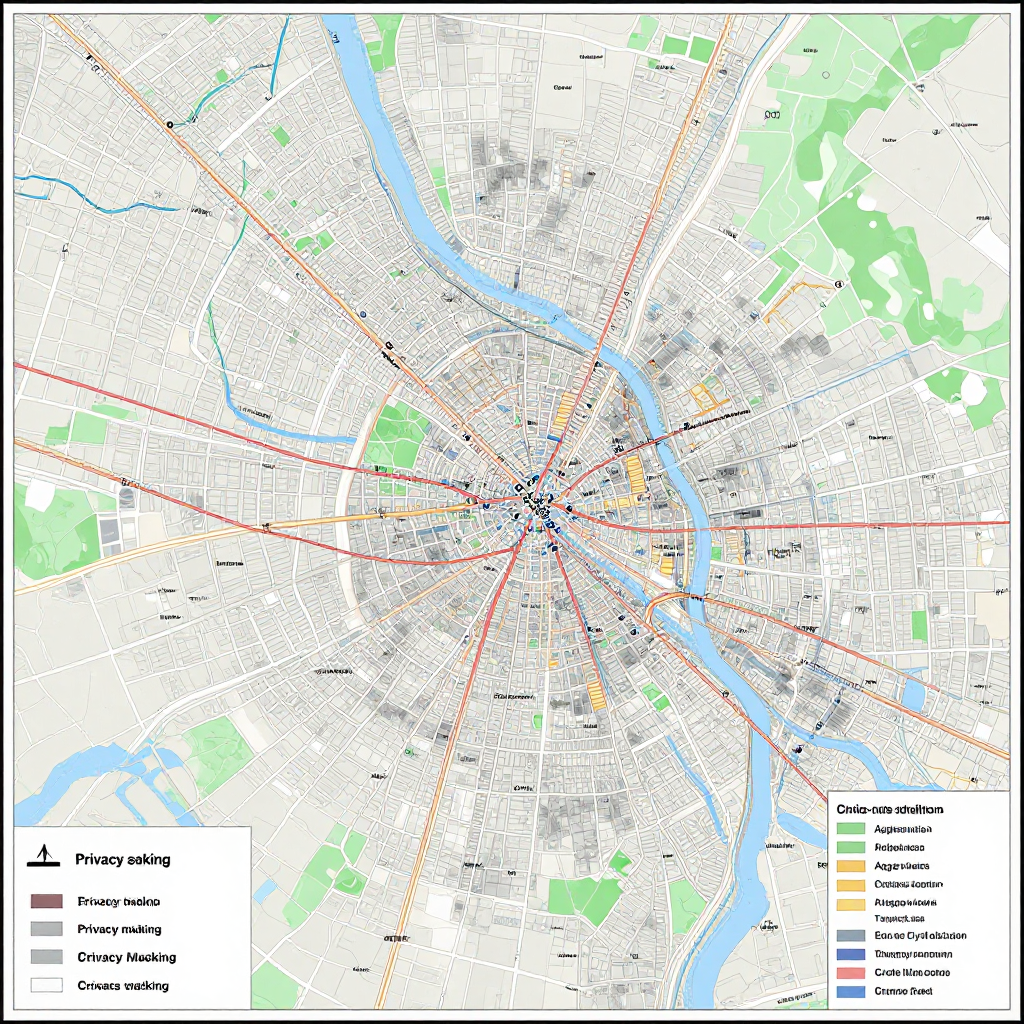
Geocoding converts addresses into geographic coordinates, but exact victim locations can create privacy risks. For research dissemination, analysts may aggregate incidents to census tracts, grid cells, administrative zones, or other units. The chosen unit influences the result through the modifiable areal unit problem: a pattern visible in large districts may disappear at a finer scale, or the reverse.
Cleaning should identify duplicate reports, inconsistent category labels, impossible dates, relocated incidents, and changes in reporting systems. Analysts should preserve an audit trail showing how each transformation was made. Missing data should be described rather than silently replaced. Imputation may be appropriate in limited circumstances, but it can create false certainty when missingness is linked to fear, access, or institutional trust.
Temporal design also matters. Monthly or quarterly windows may provide enough observations for stable estimates, while daily data may reveal short-term changes but produce many empty locations. Researchers should test whether results remain similar across reasonable time windows. Sensitive fields should be minimized, encrypted, access-controlled, and separated from public outputs. Suppression rules can prevent maps from revealing a victim, business, or vulnerable group.
Analytical Methods for Identifying Hotspots
Hotspot analysis uses several complementary methods: kernel density estimation, spatial autocorrelation, local hotspot statistics, spatiotemporal analysis, and machine learning. The right method depends on whether the research question concerns concentration, dependence, forecasting, or explanation.
Kernel density and spatial statistics
Kernel density estimation creates a smoothed surface showing where incidents are concentrated, with nearby observations contributing more strongly than distant ones. The bandwidth controls the level of smoothing. A narrow bandwidth can reveal local clusters but may exaggerate noise; a wide bandwidth produces a stable regional pattern but can hide meaningful variation.
Spatial autocorrelation tests whether nearby areas have similar values. Global measures such as Moran’s I can indicate whether incidents are clustered, dispersed, or broadly random. Local statistics, including Local Moran’s I and Getis-Ord Gi*, can identify high-value and low-value clusters relative to neighboring areas. These techniques describe spatial dependence; they do not establish why a cluster exists.
Spatiotemporal analysis and machine learning
Spatiotemporal models combine location and time to detect persistence, seasonality, displacement, or emerging concentrations. Count models, hierarchical Bayesian approaches, and panel models can incorporate population exposure and area-level differences. Machine learning methods such as random forests, gradient boosting, and regularized regression can model nonlinear relationships, provided the training data are sufficiently complete and the features are defensible.
Machine learning may improve predictive performance, but it often reduces interpretability and can reproduce enforcement or reporting bias. A transparent statistical model may be preferable when the objective is theory-building or public accountability. GIS is the visualization and spatial-analysis environment; it is not itself a guarantee of valid inference.
Building and Validating a Predictive Model
To build a predictive extortion model, define the outcome and forecast period, select defensible features, separate training from testing data, compare with a simple baseline, and report uncertainty alongside performance. Validation must imitate the conditions in which the model will actually be used.
A practical workflow is:
- Define the target: for example, the number of reported incidents in each area during the next quarter, rather than an undefined label such as dangerous neighborhood.
- Select features: use prior incidents, temporal trends, land-use measures, population exposure, service access, and carefully justified socioeconomic variables.
- Split by time or geography: a random split can leak information between neighboring areas or future periods. Temporal holdouts are often more realistic for forecasting.
- Compare baselines: test the model against recent incident counts, seasonal averages, or a simple spatial smoothing method.
- Evaluate multiple dimensions: assess calibration, ranking, error by area, false positives, false negatives, and stability across subgroups and periods.
- Document uncertainty: provide prediction intervals, confidence measures, data coverage, and known sources of bias.
Metrics should match the decision. A model used to prioritize prevention resources may need reliable calibration, while an exploratory research model may emphasize explanatory patterns. No performance score transfers automatically to another city or period. Most importantly, prediction is not causation: a variable associated with future reports may reflect reporting access, enforcement presence, or an unmeasured factor rather than a mechanism that causes extortion.
Interpreting Results for Organized-Crime Research
GIS and predictive-model outputs support organized-crime research when analysts treat them as evidence about patterns and uncertainty, then combine them with qualitative, institutional, and network information. Maps should guide questions and proportional action rather than replace investigation.
A high-risk area may warrant deeper study of business conditions, victim-support access, coercive relationships, or changes in organized crime networks. Researchers can compare hotspot persistence with known events, enforcement changes, market disruptions, transport shifts, or reports from community organizations. Network analysis may add information about relationships among alleged offenders, intermediaries, victims, and institutions, but those links require careful evidentiary standards.
For prevention, outputs can help locate confidential reporting channels, legal assistance, outreach teams, business protection programs, or victim services. For investigative prioritization, they can indicate where to review repeat reports or possible linked cases. The result should be a documented decision process: what the model showed, what it could not show, who reviewed it, and why an intervention was proportionate.
Analysts should avoid publishing fine-grained maps that expose victims or make a neighborhood a permanent symbol of organized crime. Aggregated maps, uncertainty layers, and narrative explanations usually communicate research value more responsibly than a single red-to-green risk surface.
Ethics, Limitations, and Responsible Use
Responsible extortion hotspot modeling requires safeguards against underreporting, biased enforcement data, privacy violations, stigmatization, false positives, and model drift. Human oversight must remain part of every decision that affects communities or individuals.
Common mistakes include:
- Confusing reports with prevalence: analysts may assume more reports always mean more extortion. Correct this by modeling reporting behavior, using multiple data sources where lawful, and clearly labeling observed versus estimated risk.
- Overfitting historical enforcement: a model trained on police activity can learn where authorities looked rather than where victimization occurred. Compare enforcement-linked data with independent sources and test sensitivity to those variables.
- Publishing overly precise maps: small-area outputs can identify victims or stigmatize communities. Aggregate, mask, suppress, and review disclosure risks before publication.
- Using predictions as automatic decisions: a false positive can bring surveillance or enforcement to people who have done nothing wrong. Require human review, documented thresholds, appeal mechanisms, and periodic audits.
Model drift is another concern. Reporting channels, criminal tactics, policing practices, migration, economic conditions, and data systems change over time. A model should be monitored after deployment and recalibrated only through a documented process. Transparency reports should describe data sources, feature limitations, validation design, uncertainty, and the communities likely to be affected.
Research ethics review, data-protection law, community consultation, and independent governance can strengthen legitimacy. The central test is practical: does the analysis reduce harm and improve support or prevention, or does it merely make vulnerable places easier to label?
Frequently Asked Questions
What types of crime data are needed to model extortion hotspots?
Researchers typically need incident reports, dates, locations, extortion categories, repeat-victimization indicators, and relevant contextual data. Surveys, hotline records, court data, and community reports can help reveal underreporting when collected and linked lawfully.
Which GIS techniques are useful for hotspot analysis?
Kernel density estimation, spatial autocorrelation, Local Moran’s I, Getis-Ord Gi*, spatial regression, and spatiotemporal analysis are useful choices. Each answers a different question, so method selection should follow the research objective.
How can researchers account for underreported extortion?
They can compare multiple data sources, model reporting access and behavior, use victimization surveys where feasible, document missing coverage, and present ranges rather than a single unquestioned estimate.
How should predictive models be validated?
Validation should use future or geographically held-out data, compare simple baselines, assess calibration and error types, test subgroup performance, and report uncertainty. Random splits alone may overstate performance when nearby observations are correlated.
What ethical risks arise when mapping organized-crime activity?
Risks include exposing victims, stigmatizing communities, reinforcing biased enforcement patterns, misclassifying innocent areas, and encouraging unjustified surveillance. Aggregation, privacy review, transparency, and human oversight are essential safeguards.